Today we’re shipping the Atlas at v1.0.
One map. The whole country. Every layer of land that matters, on a single canvas.
We’ve been building toward this for a long time. If you’ve ever sat in a deal meeting where six people had six different maps open — zoning on one screen, flood on another, the broker’s PDF on a third — this is the answer to that meeting.
One map. The whole stack.
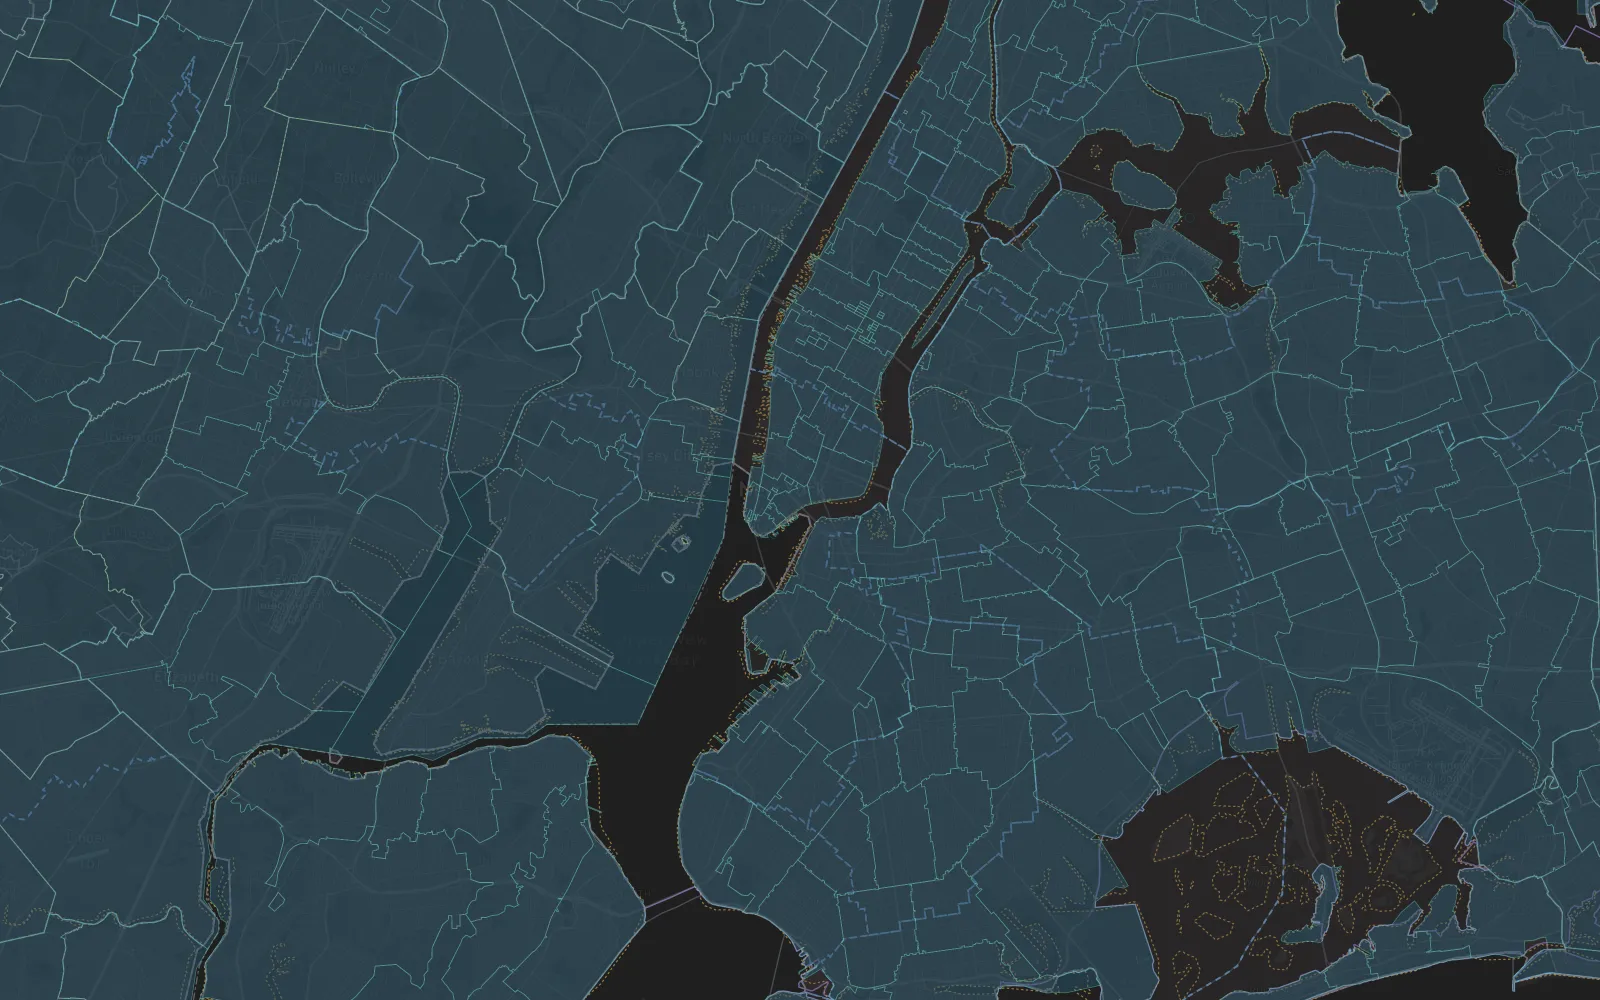
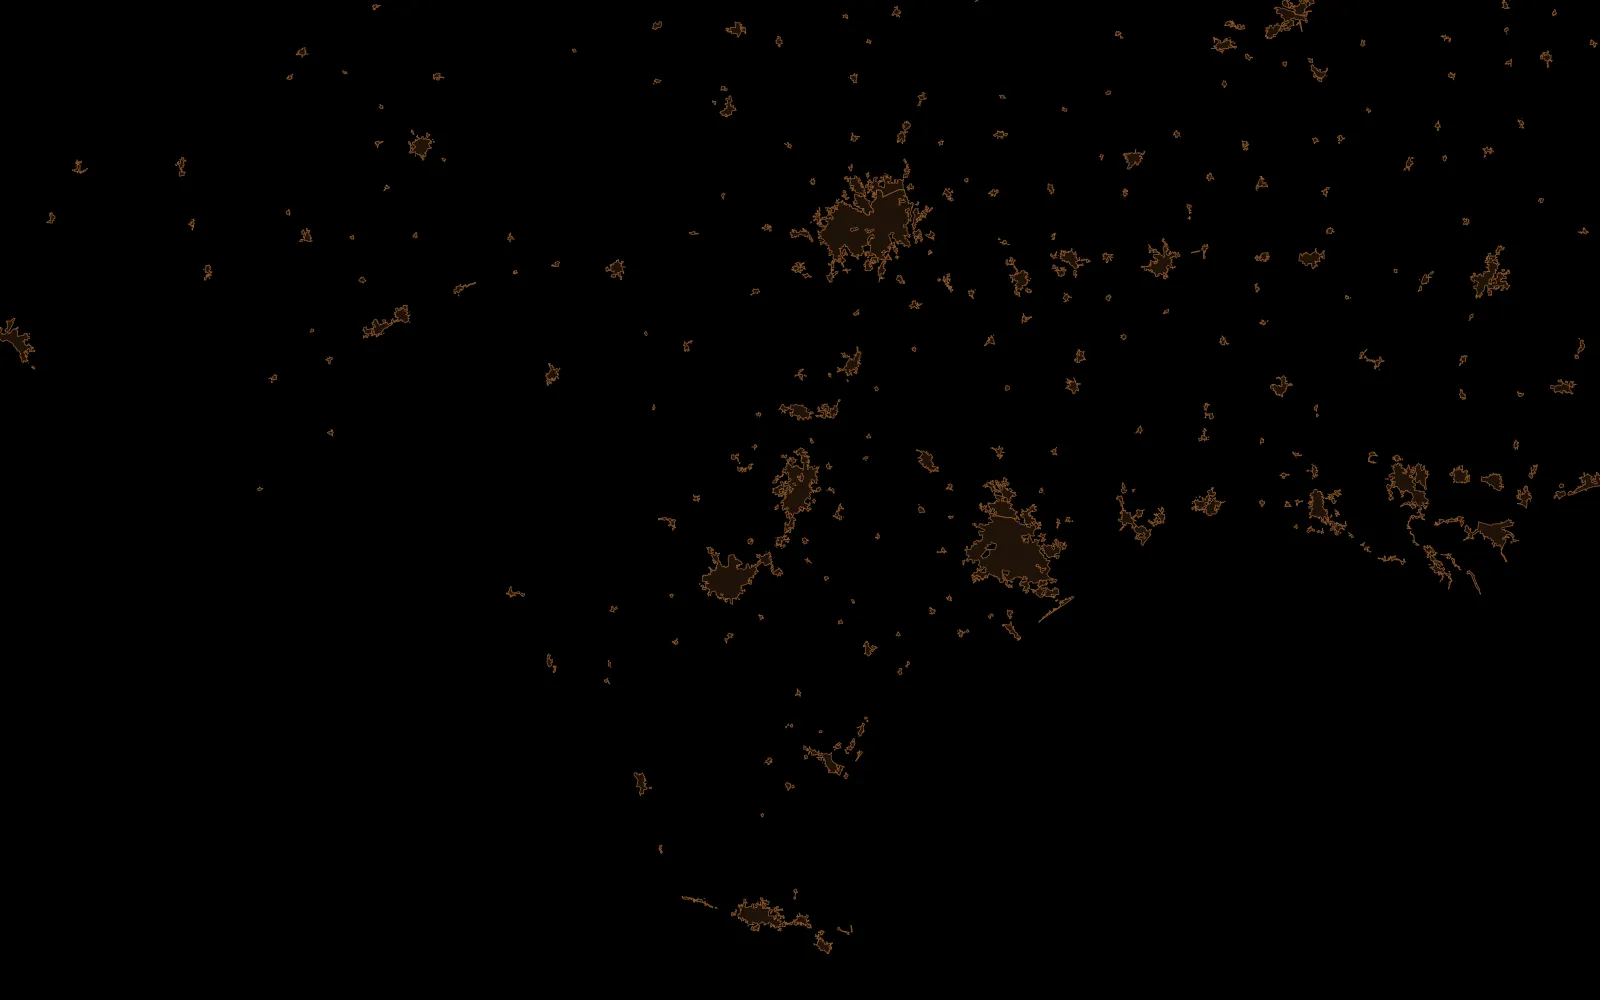
Zoning. Overlays. Flood, hazard, equity. Opportunity Zones. Airport height limits. The energy grid. Highways and freight. School districts and water districts. Counties, metros, congressional lines. Every research city we’ve shipped, color-coded by how fresh the data is.
Click anywhere and the map reads what you’re standing on: which rules apply, which overlays bite, what the county says about you, and whether the parcel has been researched yet.

Switch lenses, not tabs.
We shipped with 65 ready-made views — one for every kind of person who opens a map. A housing lens lit up density and supply. An energy lens lit up the grid and demand. A defense lens lit up airfields and approach surfaces. A transportation lens lit up freight and ports. Thirteen industry lenses. Sixty-five presets. One click between them.

Every layer on the map was yours to retint, reshape, and save — then share as a link or drop into a deck.
And — terrain.
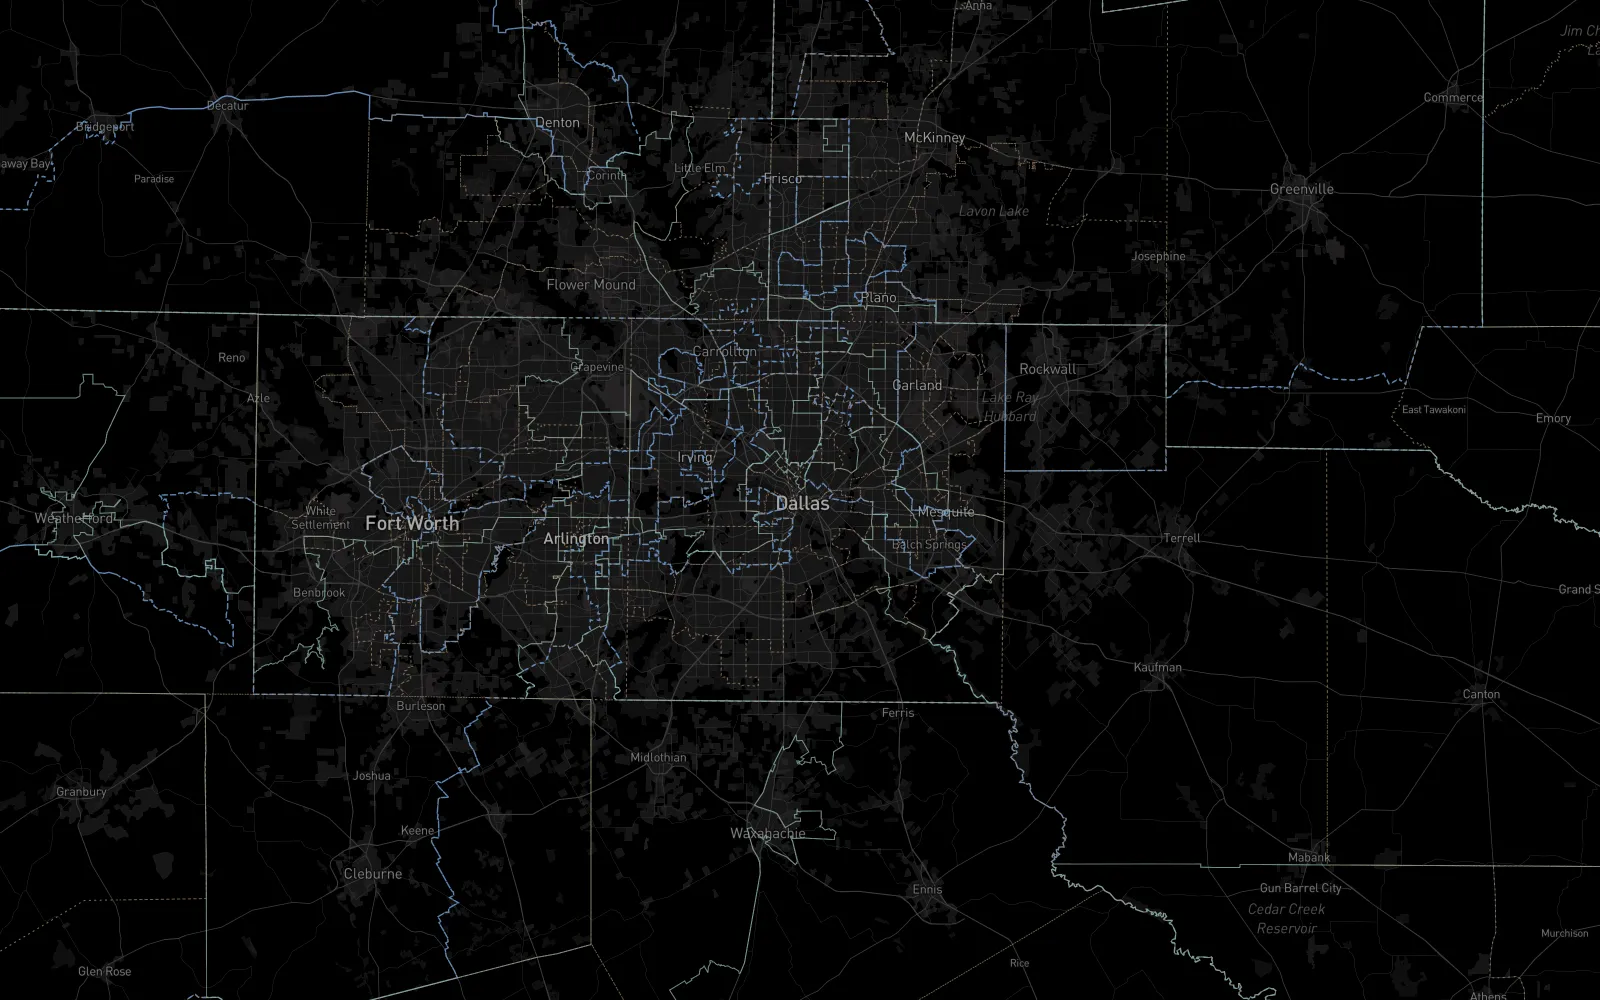
Every elevation in the lower 48 was baked in. Tilt the map and the country rose. Hillshade everywhere, at every zoom. Read the slope of a parcel without leaving the page.
Built for the people who buy land.
The Atlas was for the people who have to make a call before lunch. Developers picking the next site. Architects checking what the code would let them build. Capital allocators tracking where the next deal goes. Brokers proving a story. Land sellers checking who their neighbors are. Anyone who has ever paid for a deal-killer they could have seen on a map.
What it became.
The Atlas was the visible half of something bigger: an experiment in letting autonomous agents research and map American land use at national scale. That experiment was a massive success, and it’s written up here. The live viewer is gone — the research it proved out is very much alive.